
Sharing some interesting tidbits from a report by Aditya Birla Sun Life AMC. The report is titled: Are Indians Making Their Money Work?
Overall, the report talks about how Indians have started to shift to financial assets (bank deposits, equity, etc) from physical assets (gold, Real estate). Although physical assets are a still a big chunk of the entire portfolio of a household.
The report also compares returns across various asset classes and shows how equity allocation could have increased returns, growing affluent households in India and a comparison between US and India.
More stats, and graphs, are here:
Within financial assets—bank deposits and cash still account for a major portion. And, physical assets still dominate at two-thirds of total assets
Equity exposure has doubled from 2.2% in 2013 to 4.7% in 2023 but remains low compared to other countries. BTW, equity allocation in US is 35% in households.
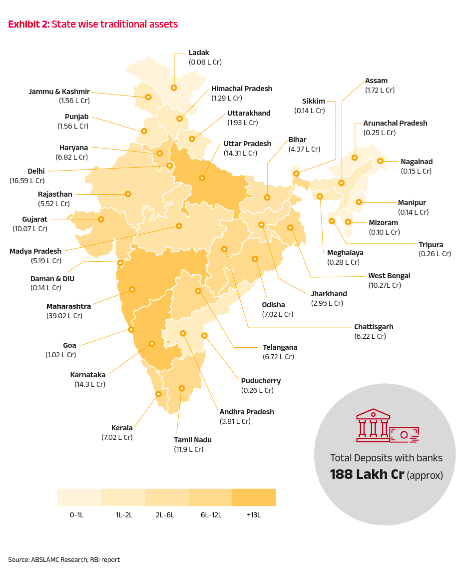
One slightly interesting bit was this India’s map that shows state wise traditional assets—3 states: Maharashtra, Goa and UP have more than 13L in deposits with banks.
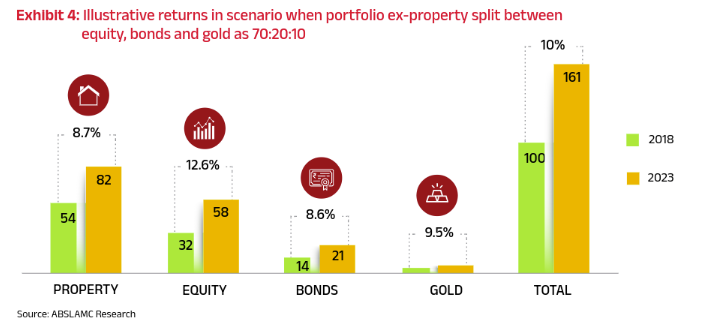
The report estimates if household allocation was split 70:30 between equity and debt over the last 5 years, it could have delivered a portfolio CAGR of 10% vs 8.5% from the historical allocation.
Traditional household asset allocation has led to a drag of 1.5% in the 5-yr portfolio CAGR or a loss of ~INR 55 trillion in investor wealth over the past 5 years.
The report projects equity allocation as a percentage of household assets could double to 10% over the next decade, driven by the India growth story.
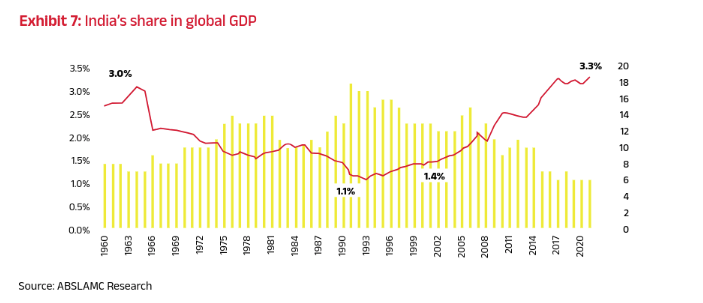
India is rising on the global stage, aided by factors like global offshoring, digitalization, and the energy transition.
This is USA’s GDP nominal GDP👇
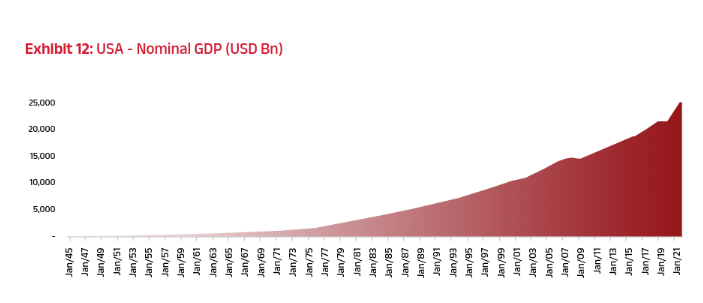
BTW, IMF recently said that India might take over Japan’s GDP next year.
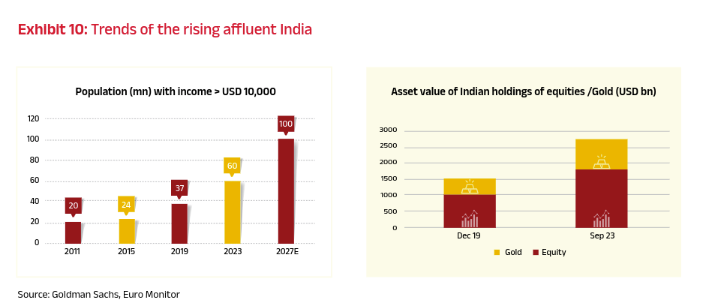
It cites the rise in the number of affluent households (per capita income over $10,000) as a key trend.
Equity mutual funds as an optimal way for retail investors to access equity markets and benefit from professional fund management, diversification, and mitigation of risks. It highlights the advantages of SIPs for disciplined and rupee-cost averaging-based investing.
US<>India parallel
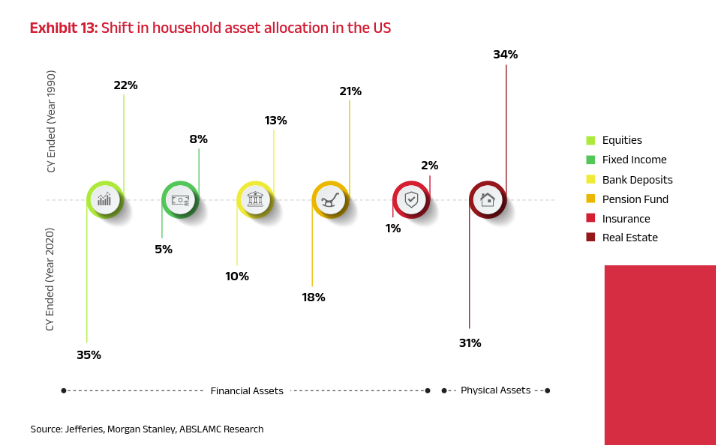
Till 1990, allocation to financial assets in the US was declining. However, post 1990, there was a reversal with increasing allocation to financial assets like equities. This was aided by regulatory changes allowing retirement funds to invest in listed equities.
Currently, financial assets constitute 70-75% of US household assets, while physical assets are just 25-30%. Within financial assets, allocation to equities has been consistently over 30% and was nearly 40% in 2022.
A similar trend could play out in India over the next 25-30 years as the economy sees sustained growth.


